One of the most powerful tools in real estate investing is sensitivity analysis. It's like having a crystal ball that shows you exactly how your investment will perform under different scenarios. But if you've ever looked at a sensitivity matrix and felt overwhelmed, you're not alone.
In this guide, we'll break down exactly how to read and interpret sensitivity analysis matrices, so you can make confident investment decisions based on data rather than guesswork.
What is Sensitivity Analysis?
Sensitivity analysis is a systematic way to understand how changes in key variables affect your investment returns. In real estate, we typically analyze how different purchase prices and financing terms (specifically Loan-to-Value ratios) impact your cash-on-cash return.
Think of it as stress-testing your investment. What happens if you pay 15% more than asking? What if you can only get 70% financing instead of 80%? These are the questions sensitivity analysis answers.
Understanding the Matrix Structure
A sensitivity analysis matrix is organized as a grid with two main dimensions:
- Rows (LTV %): Different loan-to-value ratios, from 45% to 100%
- Columns (Price Variations): Percentage changes from the base purchase price
Each cell in the matrix shows two key pieces of information:
- Cash-on-Cash Return: The percentage return on your invested capital
- Cash Invested: The actual amount of money you need to put down
A typical sensitivity analysis matrix showing how returns vary with purchase price and financing terms
Reading the Color-Coded Results
The matrix uses color coding to quickly identify investment quality:
Color Legend
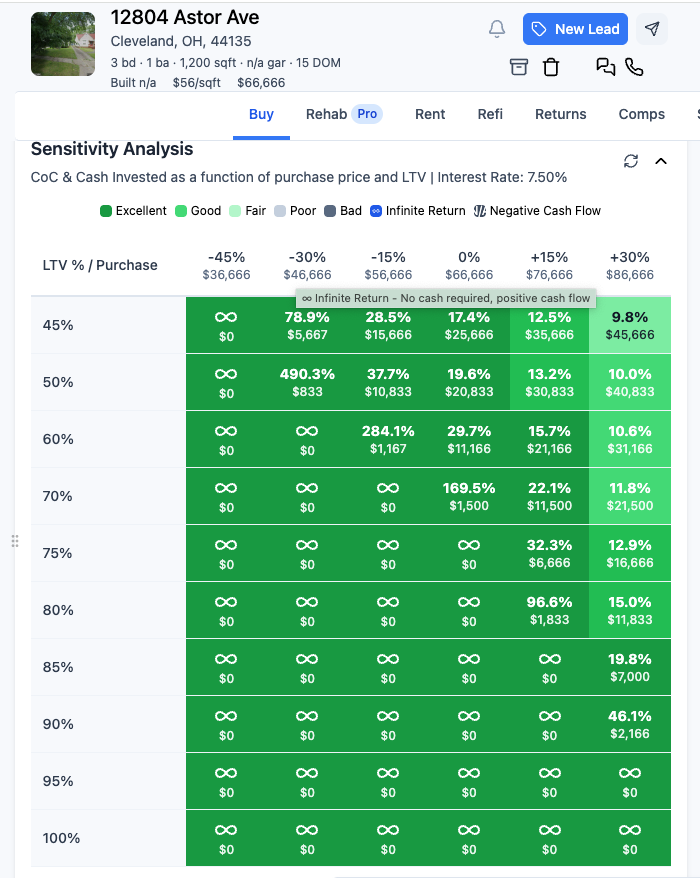
Special Cases: Infinite Returns and N/A
You'll notice some cells show special symbols instead of percentages:
Special Symbols Explained
How to Use Sensitivity Analysis for Decision Making
1. Identify Your Target Returns
Start by determining your minimum acceptable cash-on-cash return. Most investors target 8-12% minimum, with 15%+ being excellent. Look for cells that meet or exceed your target.
2. Assess Your Available Capital
Check the "Cash Invested" amount in cells that meet your return criteria. Can you afford the required down payment? If not, you may need to look at different scenarios or properties.
3. Find Your Sweet Spot
Look for the intersection of:
- Acceptable returns (your target % or higher)
- Affordable cash investment
- Realistic purchase price (not too far from market value)
4. Plan Your Negotiation Strategy
The matrix shows you exactly how much you can afford to pay while still hitting your return targets. If you need 10% returns and can invest $25,000, you can see exactly what purchase price ranges work for you.
Real-World Example: Interpreting the Matrix
Let's walk through a practical example using a typical sensitivity matrix:
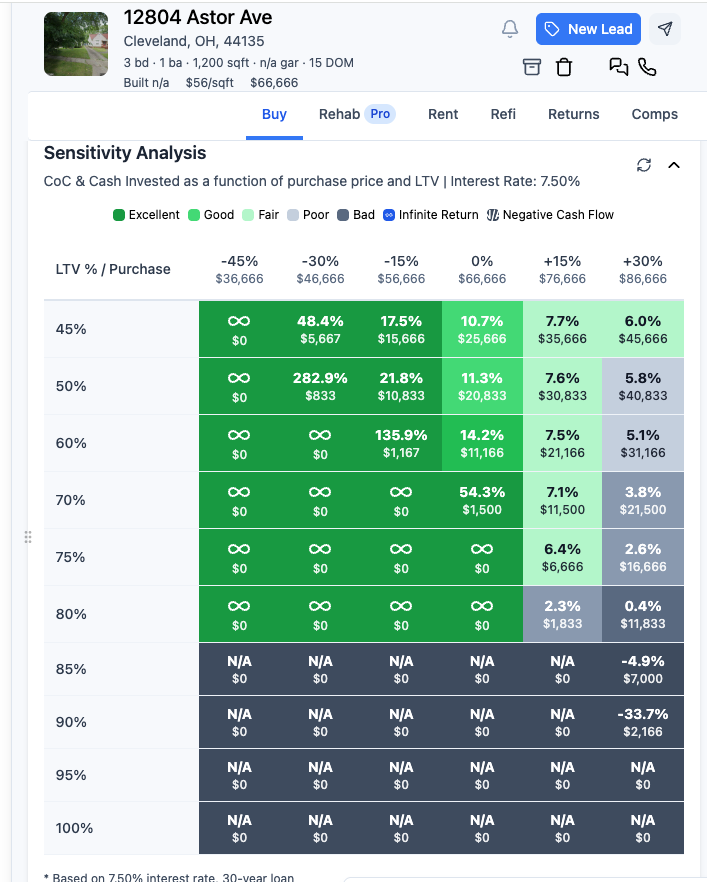
Detailed analysis of a 3-bedroom property in Cleveland, OH with $66,666 asking price
Example Scenario
Property: 3 bed, 1 bath house in Cleveland, OH
Asking Price: $66,666
Monthly Rent: $1,200
Monthly Expenses: $400
Interest Rate: 7.5%
Scenario Analysis:
Best Case (45% LTV, -45% price):
- Purchase Price: $36,666 (45% below asking)
- Cash Invested: $0
- Return: ∞ (Infinite return - no cash needed, positive cash flow)
- Verdict: Excellent if you can negotiate this price
Realistic Case (60% LTV, 0% price):
- Purchase Price: $66,666 (asking price)
- Cash Invested: $11,166
- Return: 14.2%
- Verdict: Good investment if you have the capital
Worst Case (85% LTV, +30% price):
- Purchase Price: $86,666 (30% above asking)
- Cash Invested: $7,000
- Return: -4.9%
- Verdict: Avoid - you're losing money
Key Insights from This Analysis
- Price Sensitivity: This property is very sensitive to purchase price. Paying 30% above asking turns a good investment into a money-losing proposition.
- LTV Impact: Higher LTV ratios (more financing) generally reduce cash requirements but also reduce returns due to higher debt service.
- Negotiation Power: The matrix shows you have significant negotiation leverage. Even at 60% LTV, you can pay up to 15% above asking and still get 8%+ returns.
- Risk Assessment: The property becomes unprofitable at high LTVs and high prices, helping you avoid bad deals.
Common Mistakes to Avoid
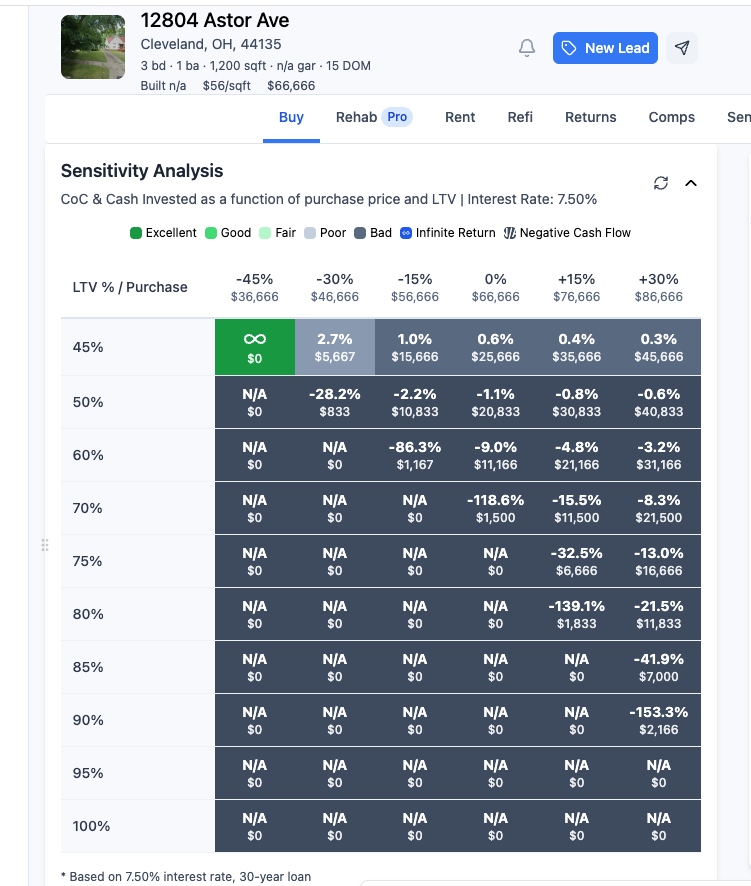
Notice the gray cells with "N/A" - these indicate negative cash flow scenarios to avoid
Pitfalls to Watch Out For
1. Ignoring Negative Cash Flow: Don't be fooled by "infinite returns" if the property has negative cash flow. You're still losing money each month.
2. Focusing Only on Returns: A 20% return might look great, but if it requires $100,000 cash investment, it might not be feasible for you.
3. Not Considering Market Realities: The matrix shows what's mathematically possible, but you need to assess whether those purchase prices are realistic in your market.
4. Ignoring the Gray Areas: Don't dismiss properties that show mixed results. Sometimes a property with moderate returns but low cash requirements is better than one with high returns but high cash requirements.
Advanced Strategies
1. Scenario Planning
Use the matrix to plan for different market conditions. What if interest rates rise? What if rents decrease? Adjust your inputs and see how it affects your returns.
2. Portfolio Optimization
If you have multiple properties, use sensitivity analysis to determine which ones to prioritize based on your available capital and return requirements.
3. Exit Strategy Planning
The matrix helps you understand your break-even points and minimum viable scenarios, which is crucial for planning your exit strategy.
Conclusion
Sensitivity analysis is one of the most powerful tools in real estate investing. It transforms complex financial scenarios into clear, actionable insights. By learning to read and interpret these matrices, you can:
- Make data-driven investment decisions
- Negotiate from a position of knowledge
- Avoid costly mistakes
- Optimize your capital allocation
- Build a more profitable portfolio
Remember, the matrix is a tool, not a crystal ball. It shows you the mathematical possibilities, but you still need to apply judgment about market conditions, property quality, and your personal investment goals.
The next time you're analyzing a potential investment, don't just look at the numbers - understand the story they're telling. Your sensitivity analysis matrix is your roadmap to profitable real estate investing.
Ready to Put This Into Practice?
BrickBear's sensitivity analysis tools make it easy to generate these matrices for any property. Try it out with your next potential investment and see how it changes your decision-making process.
Try BrickBear's Analysis Tools